1. Application scope
MTS structural testing system is applied to pseudo-static seismic test and pseudo-dynamic seismic test on structures of building and bridge. MTS structural system can provide multidimensional and multipoint loadings. Several tests can be carried in the same time. This system is the indicator of themost advanced technology in this area.
2. System configurations
1)Linear hydraulic actuators:
(1) 2500kN linear hydraulic actuator: 2
(2) 1000kN linear hydraulic actuator: 2
(3) 500kN linear hydraulic actuator: 4
(4) 250kN linear hydraulic actuator: 1
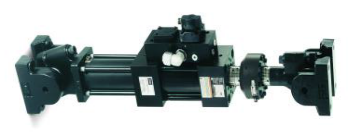
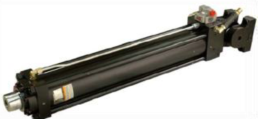

Fig.26 Linear hydraulic actuator
2) Hydraulic power supply (Type 505): Main supply is270KW, and assistant supply is 12KW. The servo flow capacity on 21Mpa is600L/min.
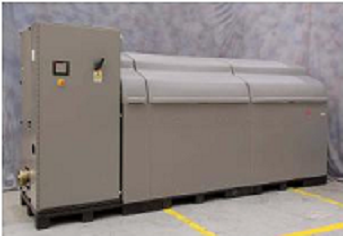
Fig.27 Hydraulic power supply
3) FlexTest control system: There areone console, one computer andand 8 stations and 12 channels of control. It iscontrolled by theelectronicmanagement.
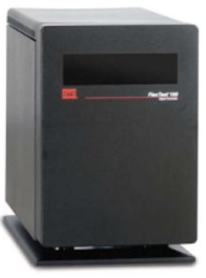
Fig.28 Control system
4)Major facilities
(1) Lateral-supporting wall system: The long wall is 24m long and 15mhigh, and the short wall is 12m long and 15mhigh.
(2) Testing platform:26m×12m
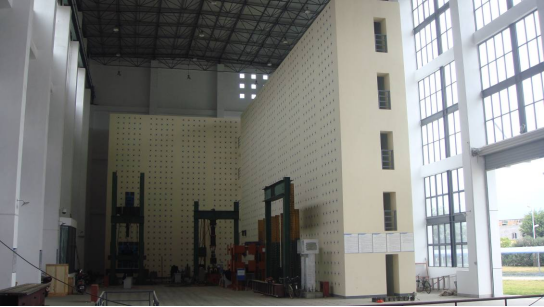
Fig.29 Lateral-supporting wall system
5) Stress-strain testing and analyzing system
(1)Dynamic stress-strain testing and analyzing system: 3 sets including a total of 160 sampling channels and thesampling frequency is not less than1 kHz.
(2) Rapidstress-strain testing and analyzing system:6 sets including a total of 896 sampling channels and thesampling frequency is not less than 5Hz.
(3) Static stress-strain testing and analyzing system: 8 sets including a total of 128 sampling channels and thesampling frequency is not less than1 Hz.
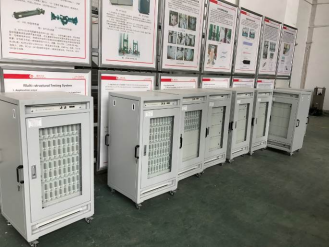
Fig.30 Stress-strain testing and analysing system
6)Assistant equipment
(1)Sliding bearings:two 3000kN and one 5000kN bearings, each has a 600mm horizontal sliding stroke.
(2)Fixed support: two2500kN bearings.
(3) Dynamical framework:the bearing capacity of the frame is 4000kN and 2000kN for static and dynamic loading, respectively.
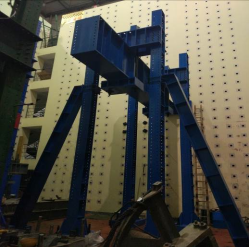
Fig.31 Assistive equipment
3. Typical Testing models
3.1 Bi-directional pseudo-dynamic tests onprestressed reinforcement system of brick-concrete structure
Afterthe "5.12" Wenchuan earthquake,Fujian Seismic and Disaster Research Center of Civil Engineering put forward the prestressed reinforcement system in view of shock absorption andseismic isolation technique.
In order toanalyse theseismic behavior of prestressed reinforcement system of brick-concrete structure, the bi-directional pseudo-dynamic tests ofthree brick-concrete structures are carried out.
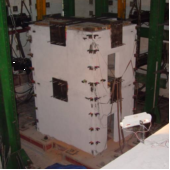
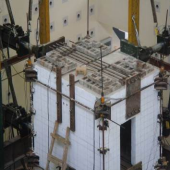
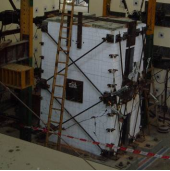
a)SJ1 b)SJ2 c)SJ3
Fig.30 Pictures of test devices
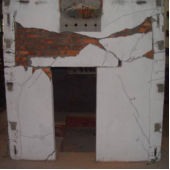

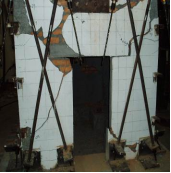
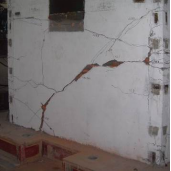
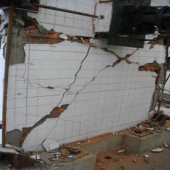
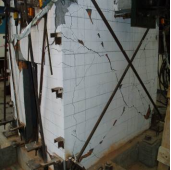
a)SJ1 b)SJ2 c)SJ3
Fig.31 Pictures of earthquake damages
3.2 Tests ofextension-type friction damping
In 2011, the tests of extension-type friction damping are carried out by theundergraduates fromNational Quemoy University.Thepurpose of the tests is toestablish theformula ofrelationship betweenfriction factor and the ambience. Themechanicalbehaviour ofextension-type friction damping and thefeatures ofhydraulic shock absorber areobtained.
Theseries of tests are carried under the load ofsimple harmonic waves which aretaken account of the torque value,forcing frequency andamplitude.The wholenumber oftests is 225, the number of the torque value is 3, the number of forcing frequency is 5, the number of amplitude is 5,and the number of friction material is 3.
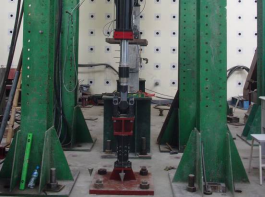
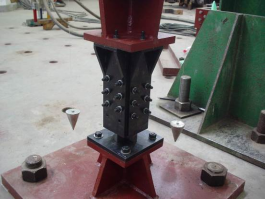
Fig.32 Pictures of test devices

Fig.33 Picture of test specimen damage
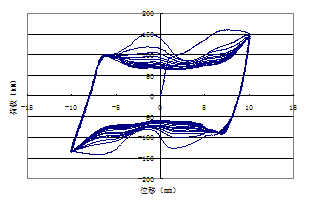
Fig.34 Curve of load -displacement
3.3 Nonlinear vibration test ofcable-beam structure
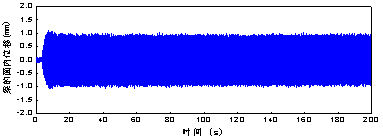
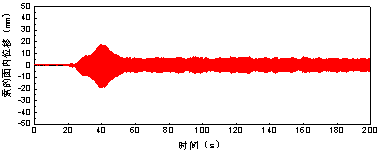
Thecable stayed bridge issimplified to be acable-beam structure that can be seen in Fig.1.The nonlinear vibration tests ofsingle cable-beam structure and multi cable-beam structure are carried out to study theparametric vibration ofstay cable.When thefrequencyofcyclic load isclose to two times of the first order natural frequency,large amplitude in-plane displacement andout-plane displacement ofstay cable will be happened.
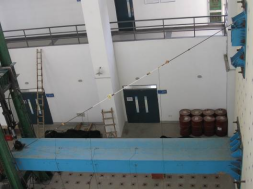
(a)Test model of single cable-beam
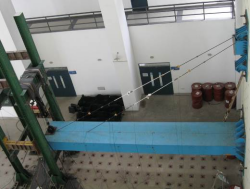
(b)Test model of two cables-beam
Fig.35 Test model ofcable-beam structure
(a)The in-plane displacement of beam
(b)The in-plane displacement of stay cable

(c)The out-plane displacement of stay cable
Fig.36 The displacement time history of singlecable-beam structure under vertical cyclic load
3.4 Seismic performance test and fem analysis of uniform sectional cfst lattice column with flat lacing tubes
To study the seismic performance of uniform sectional concrete-filled steel tubular (CFST) lattice column with flat lacing tubes, the quasi-static tests are conducted for seven test specimens focused on the effects of different concrete strength, longitudinal spacing of CFST limbs, and vertical spacing of lacing tubes on stiffness, strength, and ductility. By analyzing the damage modes, the load-displacement hysteretic loops, and the skeleton curves, the following conclusions can be derived: all the specimens have good seismic performance, characterized by the overall bending damage, and the horizontal load-displacement hysteresis curves are plump; with the increase of concrete strength from C40 to C60, the bearing capacity is improved by 5.7%; as the longitudinal spacing of CFST limbs increased from 250mm to 650mm, the bearing capacity and the ductility factor are significantly improved by 14.5% and 6.8%; as the vertical spacing of lacing tubes increased from 200mm to 313mm, the bearing capacity and the ductility factor are respectively reduced by 12.9% and 12.0%.
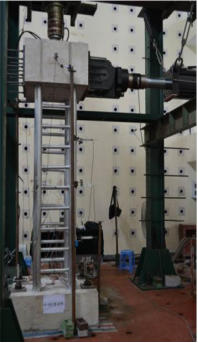
fig.37 Photo ofactual loading test


(a)
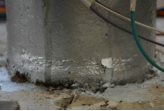
(b)fig.38 Damage mode
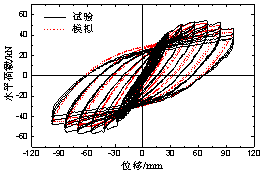
fig.39 Horizontal load - displacement hysteresis curve
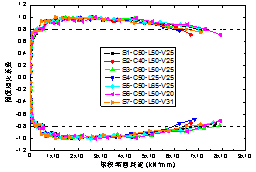
fig.40 Strength degradation curve
3.5 Anti-fatigue performance study on welding seam of cable-to-girder anchorage with tensile anchor plate
Tostudy the anti-fatigue performance of the welding seam of cable-to-girder anchorage with tensile anchor plate, a fatigue test was conducted on a 1:2.5 scale-model, and the stressdistribution law and fatigue performance of the tensile anchor plate in cable-stayed bridge are investigated. The results showed that the critical positions of cable-to-girder anchorage with tensile anchor plate were not only the welding seams where tensile anchor plate connects stiffeners and beam, but also the region around central openings in the tensile anchor plate. Both the dynamic strain time-history curves and the static stress-load curve presented linear relationships in the process of loading. For static loading, the cycle-index had little influence on Von. Mises stress and stress-load curve of the test points. The stress amplitudes of all the welding seams in the cable-to-girder anchorage with tensile anchor plate were less than the allowable fatigue stress provided in standard of BS5400.
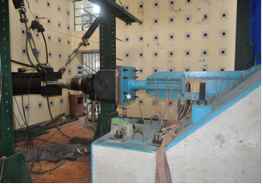
Fig.41 Photo of actual loading test
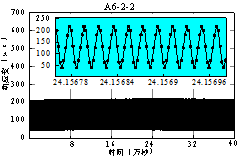
Fig.42 Straintime-history curve ofatest point
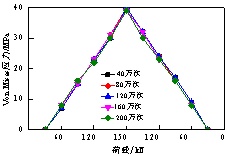
Fig.43 Stress-load curve under static loads
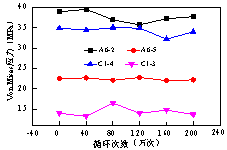
Fig.44 Von. Mises stress under static loads
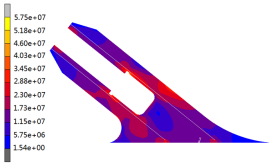
Fig.45 Von. Mises stresscontour plot of anchor plate after different loading cycles
3.6 STUDY ON FATIGUE PERFORMANCEOF CHS K-JOINT
Tostudy fatigue performance of CHS K-joint, a fatigue test was conducted on a full-size CHS K-joint model by MTS servo loading system, and initial distress and fatigue cracks were detected by phased-arrayultrasonic system, besides, strains on measuring points were monitored continuously by high-speed dynamic collection system.It is found that fatigue life of CHS K-joint in the stage of fatigue crack initiation accounts for 91.20% of full life cycle, and when the fatigue crack penetrates the full thickness of chord, dynamic strain on the location demonstrates the ladder-like change, and then the length of fatigue crack increases rapidly.
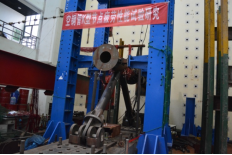
Fig.46 Fatigue test on CHS K-joint
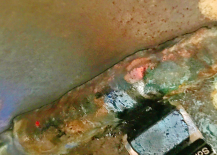
Fig.47 Fatigue crack on CHS K-joint
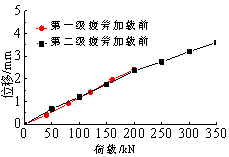
Fig.48 Load-displacement curve before fatigue test
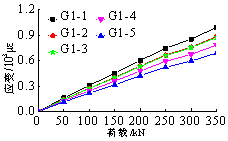
Fig.49 Load-strain curve before fatigue test
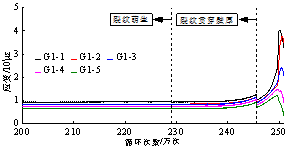
Fig.50 Loading index-dynamic strain curve
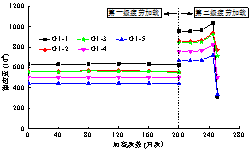
Fig.51 Loading index-strain curve

Fig.52 Examined result of fatigue crack

Fig.53 3D scanning of fatigue crack